
Cannabis Inbreeding by the Numbers: What S1s, IBLs and Backcrosses Really Do


Every seed pack carries a code: F1, F2, S1, BX3, IBL. Each one describes how the seeds were made, and each says something precise about how much the plants inside will vary. Most growers learn the labels. Far fewer know the numbers behind them.
Cannabis inbreeding is the engine behind most of those labels. This article turns it into numbers you can use: how fast each breeding method locks in traits, how many seeds you need to pop to find what you’re after, and what controlled studies show inbreeding costs a cannabis plant. The practical picture comes first. The deeper maths and simulations follow for readers who want to see how it works.
Table of Contents
Inbreeding at a glance
The generation-by-generation figures are standard genetics maths, which is very reliable. The costs and benefits come from a small number of controlled cannabis and hemp studies.
50%
of the remaining hidden variation is lost with every generation of selfing (S1, S2, S3…).
4 vs 11
generations to get below 10% hidden variation: selfing versus a single brother-sister line.
−63%
flower dry weight in one selfed hemp family compared with two outcrossed families.2
1 · Inbreeding buys predictabilityEach generation of inbreeding shrinks the hidden variation a plant can pass on, so offspring look more alike. Selfing does it fastest; sibling crosses with many parents barely move.
Higher confidenceMain limitation: the maths describes averages; selection and chance shift any single line.
Higher confidenceMain limitation: the maths describes averages; selection and chance shift any single line.
2 · It has a costIn controlled studies, selfed and heavily inbred cannabis lines were smaller, yielded less and developed more flower abnormalities.2,3,4
Moderate confidenceMain limitation: few studies, few cultivars, mostly hemp.
Moderate confidenceMain limitation: few studies, few cultivars, mostly hemp.
3 · The payoff is the F1 hybridIn two recent studies, crossing inbred lines gave F1 seed that was more uniform and more vigorous than the inbred lines it came from.3,4
Moderate confidenceMain limitation: small-scale trials; results depended heavily on which lines were paired.
Moderate confidenceMain limitation: small-scale trials; results depended heavily on which lines were paired.

Seed-pack decoder. What each label means genetically, and what to expect when you pop the seeds. “Variation left” is the share of the starting plant’s hidden variation (heterozygosity) still able to segregate. For more on the terms themselves, see our guide to seed and breeder terminology.
| On the pack | How it’s made | Variation left | What to expect |
|---|---|---|---|
| F1 | Two different parents crossed | Depends on the parents | Uniform only if both parents were inbred; most cannabis F1s vary because their parents carry hidden variation |
| F2 | Two F1 siblings crossed | 75% of the F1’s | The widest spread; hidden traits reappear (1 plant in 4 for a single recessive trait) |
| S1 | A plant pollinated by its own (reversed) flowers | 50% of the mother’s | A reshuffle of the mother, not a copy of her; her hidden traits appear |
| S2, S3… | Selfing repeated | 25%, then 12.5%… | More uniform every generation; vigour may drop |
| F3–F7 / “IBL” | Sibling crosses over generations | 63% to 27% with one pair; much more with many parents | Slowly more uniform; depends heavily on the breeder’s selection |
| BX1, BX2, BX3 | Crossed back to one parent, usually the mother | 75%, 87.5%, 93.75% from that parent on average | Increasingly like the recurrent parent, with wide plant-to-plant spread |
| Fem F2–F6 / “fem IBL” | A reversed sister pollinates her sisters, generation after generation | Same as a regular sibling line with the same number of parents | All female; both parents can be judged on flower; the line can never make a true male again |
| Feminised (any) | A reversed female pollinates a female | Depends on whose pollen: herself (S1), a sister, or an unrelated plant | All female; the genetics depend on whose pollen was used |
1. Hidden variation, in plain English
Section summary
- Every cannabis plant carries two copies of each gene. Where the two copies differ, the plant is heterozygous and can pass on either version.
- Cannabis naturally crosses between separate male and female plants, so most plants carry a lot of hidden variation. That is why seeds from a great plant vary.
- Inbreeding, meaning crossing relatives or a plant with itself, shrinks that hidden variation. Offspring become more alike, but harmful hidden traits surface too.
Think of each gene as a pair of cards, one from each parent. When the two cards match, the plant is homozygous for that gene and every seed gets the same card. When they differ, the plant is heterozygous and each seed gets one card or the other at random. A plant with many mismatched pairs produces seeds that reshuffle in countless ways, even if the mother looked perfect.
Cannabis is especially prone to this. Male and female flowers grow on separate plants, so plants normally cross with unrelated partners and stay heterozygous at many genes. Inbreeding reverses that, crossing relatives or a plant with itself so that more gene pairs end up matching. Matched pairs breed true, which is what makes a line uniform. They also expose the occasional harmful recessive version that heterozygous plants keep hidden, which is the root of inbreeding depression.
2. What each breeding method does to your genetics
Section summary
- Selfing (S lines) halves the remaining hidden variation every generation: 50% at S1, 25% at S2, about 3% by S5.
- Sibling crosses are far slower: one brother × sister line still has about a third of its hidden variation at F6, and lines made from many parents keep most of it.
- Backcrossing pulls the line towards one parent: 75%, 87.5% and 93.75% of that parent’s genome on average at BX1, BX2 and BX3.
- Feminised sibling lines (sister × reversed sister) inbreed at exactly the same rate as brother × sister lines. What matters is how many pollen donors you use, not their sex.
Figure 1, near the top of this article, shows the core arithmetic. Selfing a plant halves the hidden variation in its offspring, and the next selfing halves it again. Making an S line from a female requires reversing some of her flowers to produce pollen, usually with silver thiosulfate; foliar sprays of it reliably produced male flowers on female hemp in a controlled study.6 Getting below 10% hidden variation takes four rounds of selfing.
Sibling crosses work more slowly because brother and sister share only part of their genetics. With a single brother and sister each generation, an F4 still carries half the starting variation and an F6 about a third; dropping below 10% takes about 11 generations.1 Most breeders cross several males and females each round, which slows things further: with ten of each, an F6 keeps almost 90% of the original variation. That is why many seed lines sold as “IBL” are far less fixed than the name suggests, unless the breeder has also selected hard for the traits that matter.

Backcrossing works differently. Each cross back to the same parent, usually the mother, halves what remains of the other parent’s genome on average (Figure 3). The averages hide a wide spread: in our simulation, individual BX3 plants carried anywhere from about 87% to 99% of the recurrent parent’s genome. A BX3 is a family of plants that resemble the mother to varying degrees, not a batch of clones.
Feminised sibling lines: same maths, different practice
Many modern lines are bred entirely from feminised seed. One sister is reversed with silver thiosulfate and her pollen goes on her sisters, generation after generation. Genetically this is the same as a brother × sister cross. The inbreeding formula depends only on how closely the two parents are related, and two sisters from the same parents are full siblings.1 A line made with one sister and one reversed sister each generation therefore follows the brother × sister curve in Figure 1 exactly. Reversal changes which flowers a plant makes, not her genes.6
| Parents each generation | Regular line | Feminised line | Variation left at F4 | Variation left at F6 |
|---|---|---|---|---|
| One pollen donor, one seed plant | 1 brother × 1 sister | 1 reversed sister × 1 sister | 50% | 33% |
| One pollen donor, five seed plants | 1 male × 5 females | 1 reversed sister × 5 sisters | 61% | 44% |
| Two pollen donors, two seed plants | 2 males × 2 females | 2 reversed sisters × 2 sisters | 67% | 51% |
| Ten pollen donors, ten seed plants | 10 males × 10 females | 10 reversed sisters × 10 sisters | 93% | 88% |
Three practical differences matter more than the maths. The first is the number of pollen donors: the common feminised approach of one reversed sister on several sisters is equivalent to one male on several females, so with five seed plants the line keeps about 44% of its hidden variation at F6. The second is selection. In a regular line the male is chosen on vigour or structure because he never shows flower; in a feminised line both parents can be judged on flower. Basic selection theory says that should fix the flower traits you select for faster, though we found no cannabis study that compares the two directly. The third is accidental selfing: if the reversed sister also pollinates her own flowers, some seeds are S1s rather than sibling crosses, which speeds inbreeding and mixes two kinds of seed in one batch.
A feminised line also carries no Y chromosome, so it can never produce a true male again and every future cross depends on reversal. Whether all-female lines drift towards hermaphroditism is still unproven. The closest evidence is indirect: in the Southern Cross study, inbreeding worked best through male plants, and 8 of 22 attempts to inbreed through female plants of separate-sex accessions failed. That study used selfing rather than sister crosses, though.3
3. How many seeds should you pop?
Section summary
- For one recessive trait hidden in an F2 or S1, grow about 11 female plants for a 95% chance of finding it.
- Each extra trait you want in the same plant multiplies the number by four: 47 plants for two traits, 191 for three, 766 for four.
- Bigger hunts find better plants, but the gains shrink fast: 10 plants give a best plant about 1.5 standard deviations above average, 1,000 plants about 3.2.

If a recessive trait (a leaf shape, an unusual colour or aroma, an autoflowering habit) is hidden in both parents, one plant in four will show it. For a 95% chance of at least one, you need 11 plants. Want two such traits together and the odds fall to one in 16, so you need 47 plants. Three traits need 191 and four need 766. Backcrossing to a parent that already shows the trait halves the odds per trait instead of quartering them, which is why breeders use backcrosses to lock traits in.
| Wanted together | F2 / S1: odds per plant | Plants for 90% | Plants for 95% | BX1: odds per plant | Plants for 95% |
|---|---|---|---|---|---|
| 1 recessive trait | 1 in 4 | 9 | 11 | 1 in 2 | 5 |
| 2 traits | 1 in 16 | 36 | 47 | 1 in 4 | 11 |
| 3 traits | 1 in 64 | 147 | 191 | 1 in 8 | 23 |
| 4 traits | 1 in 256 | 589 | 766 | 1 in 16 | 47 |
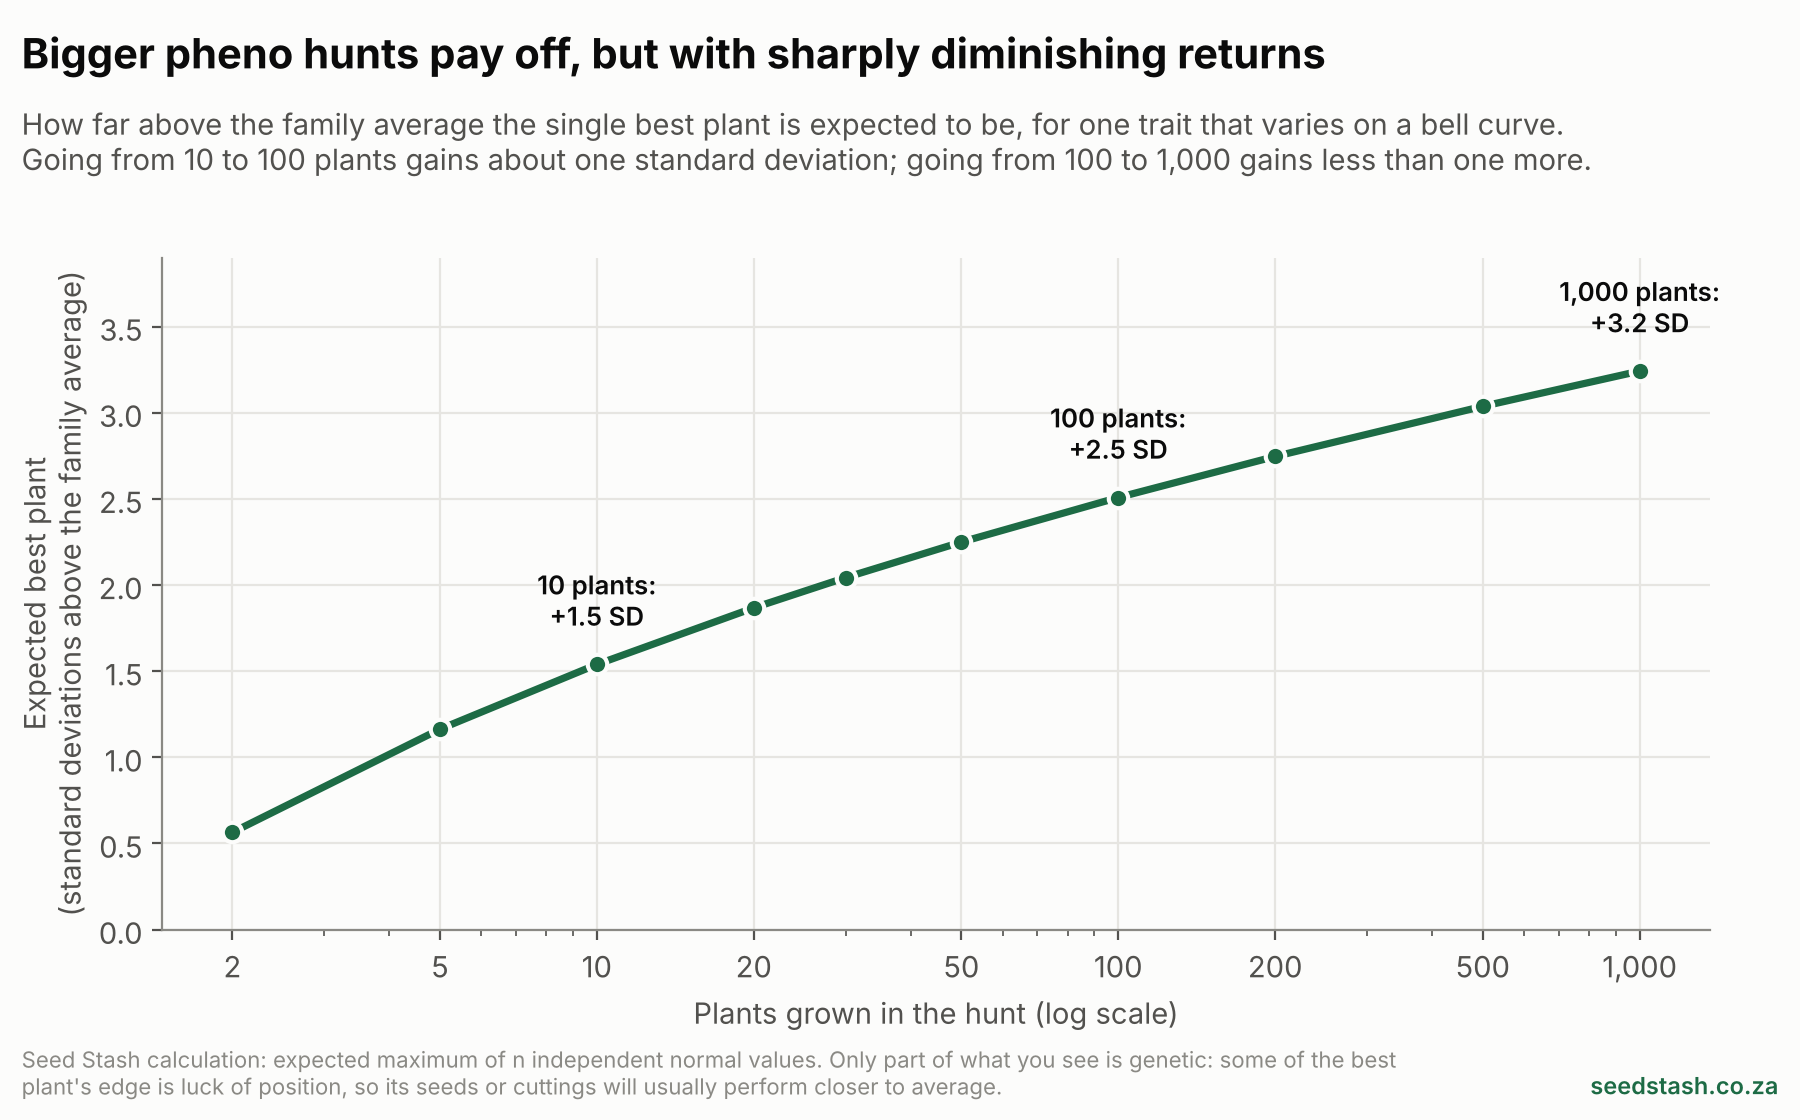
Most traits that matter for flower quality depend on many genes, so they vary along a bell curve rather than showing up as yes-or-no. Here the question becomes how good the best plant is likely to be. Figure 5 shows the answer: growing 10 plants gives a best plant about 1.5 standard deviations above the family average, and 100 plants about 2.5. Going to 1,000 adds less than one more. There is a further catch. Part of the best plant’s edge is luck, such as a better spot in the room, so its offspring or cuttings will usually perform closer to the average. Our breeder’s guide to pheno hunting covers how to run a hunt in practice.
4. What inbreeding costs: the cannabis evidence
Section summary
- In one hemp study, a selfed family produced 63% less flower and varied far more from plant to plant than two outcrossed families.
- In a 2026 study, inbred lines developed flower abnormalities and lower seed yields from about the fourth generation; only 5 lines reached S6.
- The evidence is consistent but thin: a handful of hemp and cannabis cultivars in controlled settings.

The clearest numbers come from the University of Connecticut. Kurtz and colleagues selfed the hemp cultivar ‘Candida’ using silver thiosulfate and grew the offspring beside two outcrossed families that shared one parent with it, 12 plants each.2 The selfed plants averaged 79.3 g of total dry weight against 190.3 g and 195.0 g for the outcrosses, and 37.3 g of flower against 101.9 g for both. They were shorter, every selfed plant showed leaf variegation at some stage, and they were less uniform: plant-to-plant variation in flower weight was 63.7% against 25.8% and 33.9%.2 Genetic testing confirmed lower heterozygosity in the selfed family.2
The lower uniformity surprises many growers, but it is what theory predicts for a first-generation self. Every hidden trait in the mother segregates at once, including harmful ones, so some S1 plants are hit hard and others barely at all. Uniformity comes later, as repeated inbreeding fixes the line.
Two newer studies follow lines over several generations. At Southern Cross University in Australia, Garcia-de Heer and colleagues inbred 16 hemp and cannabis accessions by single-seed descent, using silver thiosulfate and ethephon to make plants produce flowers of the opposite sex.3 From about the fourth generation, every line showed flower abnormalities and lower seed yields; in one line, abnormal flowers rose from 0.4% to 13.7% of flowers by S6. Only five lines reached S6, and four were stopped by problems such as poor seed set or slow flowering. Two of four S6 lines tested were significantly lighter than the plants they started from.3 In the US, McDonald and Lubell-Brand selfed two hemp cultivars to S4 and found one line’s S4 plants “uniformly diminutive”, which the authors attribute to inbreeding depression.4
One popular belief we could not test is that S1 seeds are more prone to hermaphrodites. We found no controlled study that measured it directly, though rising flower abnormalities under inbreeding3 fit the idea. For what is known about feminised seed and males, see can feminised seeds produce males?
Moderate confidence: inbreeding reduces vigour and yield and raises flower abnormalities in cannabis. Three controlled studies agree, but they cover few cultivars, mostly hemp, and only one gives detailed per-plant numbers.
5. Why breeders inbreed anyway: the F1 hybrid payoff
Section summary
- Crossing two inbred lines produces F1 seed that is more uniform and often more vigorous than either line (hybrid vigour).
- In a 2026 study, F1 hybrids beat their inbred parents’ average seed yield by 3.9% to 155%, and four of five out-yielded their parents.
- Commercial seed lots without this discipline vary widely: many CBD hemp seed lots tested contained mixed plant types.
If inbreeding costs vigour, why do it? Because crossing two different inbred lines can give you uniformity and vigour together. Every F1 plant from two fully inbred parents gets the same pair of gene versions, so the F1s are genetically near-identical, and the mismatched pairs restore the vigour that inbreeding stripped away. This is how most modern hybrid crops are produced.
Cannabis is only starting to test this. In the Southern Cross University study, F1 hybrids made from inbred lines were statistically more uniform than both the inbred lines and the original populations. They out-yielded their parents’ average seed yield by 3.9% to 155%, mainly through heavier seeds.3 Cannabinoid chemotype, though, stayed stable in some combinations only. In the US study, F1 hybrids of two selfed cultivars were more uniform and had higher plant and flower dry weight and higher CBD and THC percentages than one cultivar’s self-lines.4
The contrast with ordinary seed is stark. When researchers at the University of Georgia genotyped 22 commercial high-CBD hemp varieties, most of the seed-grown ones split into two or more genetic groups. Two products sold under the same name were no more related than random pairs, and 89 of 137 plants tested exceeded the US 0.3% THC limit.5 Uncontrolled seed production makes for unpredictable plants, and deliberate inbreeding followed by hybridisation is the tool that fixes it.
Moderate confidence: F1 hybrids from inbred cannabis lines can be more uniform and vigorous. Two small controlled studies, both stressing that results depend on which lines are paired. Moderate: commercial seed lots often vary widely (one large genetic survey of US hemp seed).
Going deeper: the maths and simulations
The sections below explain where the numbers come from, why two breeders inbreeding the same plant end up with different lines, and what backcross percentages leave out.
6. The maths behind the curves
Section summary
- Geneticists track inbreeding with the inbreeding coefficient F. Hidden variation left = 1 − F.
- Selfing: F rises to 1 − (½)t after t generations. Sibling crosses follow a slower formula; many-parent lines are slower still.
- Selection on visible traits can fix those traits much faster than the rest of the genome.
The inbreeding coefficient F is the probability that a plant’s two copies of a gene are identical because they descend from the same ancestral copy.1 Starting from F = 0, hidden variation is 1 − F. For selfing, each generation halves what remains: 1 − F = (½)t. For a single brother × sister pair each generation, F follows Fₜ = (1 + 2Fₜ₋₁ + Fₜ₋₂) / 4, giving the 75%, 62.5%, 50%, 40.6%… sequence in Figure 1.1 We checked both by simulating 200,000 lines; results matched to within 0.3 percentage points.
With several parents per generation, the rate depends on the effective population size, Ne = 4 × males × females ÷ (males + females). Hidden variation then falls by roughly 1 ÷ (2Ne) each generation.1
| Parents used each generation | Effective size (Nₑ) | Variation left at F4 | Variation left at F6 |
|---|---|---|---|
| 1 male × 1 female | 2 | 50% | 33% |
| 1 pollen donor × 5 seed plants | 3.3 | 61% | 44% |
| 2 males × 2 females | 4 | 67% | 51% |
| 5 males × 5 females | 10 | 86% | 77% |
| 10 males × 10 females | 20 | 93% | 88% |
These figures describe the genome as a whole, with no selection. Real breeders select, and selection changes the picture for the traits that matter. If a breeder discards every plant without a wanted trait each generation, the genes behind that trait fix much faster than the genome average, while unselected traits drift. A line can therefore breed true for the traits on the label and still vary in ones nobody was watching.
7. Why two inbred lines from the same mother aren’t the same
Section summary
- Inbreeding fixes genes, but which version gets fixed is largely down to chance.
- In our simulation, eight S6 lines from one mother each became uniform, but their averages ended up spread over a wide range (scores of 83 to 118 against an S1 average of 100).
- So “the S6 of a famous cut” from two breeders can be two quite different plants.

To show this we simulated single-seed descent, the method in the Southern Cross study,3 for a trait controlled by 200 genes spread across cannabis’s 10 chromosome pairs. Each generation, one plant from each family was selfed to start the next. Panel A shows the payoff: plant-to-plant spread within each line fell from 10 to about 6 points by S6, the floor set by environment alone. Panel B shows the catch. Eight lines started from the same mother ended up at averages from about 83 to 118, because each line fixed a different random mix of her gene versions.
This matches what the Southern Cross team saw in real plants: the drop in heterozygosity from generation to generation was “highly variable” between lines.3 For breeders, the lesson is to start several lines from a valuable plant and select between them, rather than expecting any one line to reproduce the mother.
8. Backcrossing: the spread and the drag
Section summary
- Backcross percentages are averages; individual plants vary a lot around them.
- When you select for one donor trait, the chunk of donor chromosome around it shrinks slowly: in our simulation, from a median of 81 cM at BX1 to 34 cM at BX5.
- That linked chunk can carry unwanted traits along with the one you want, which is called linkage drag.
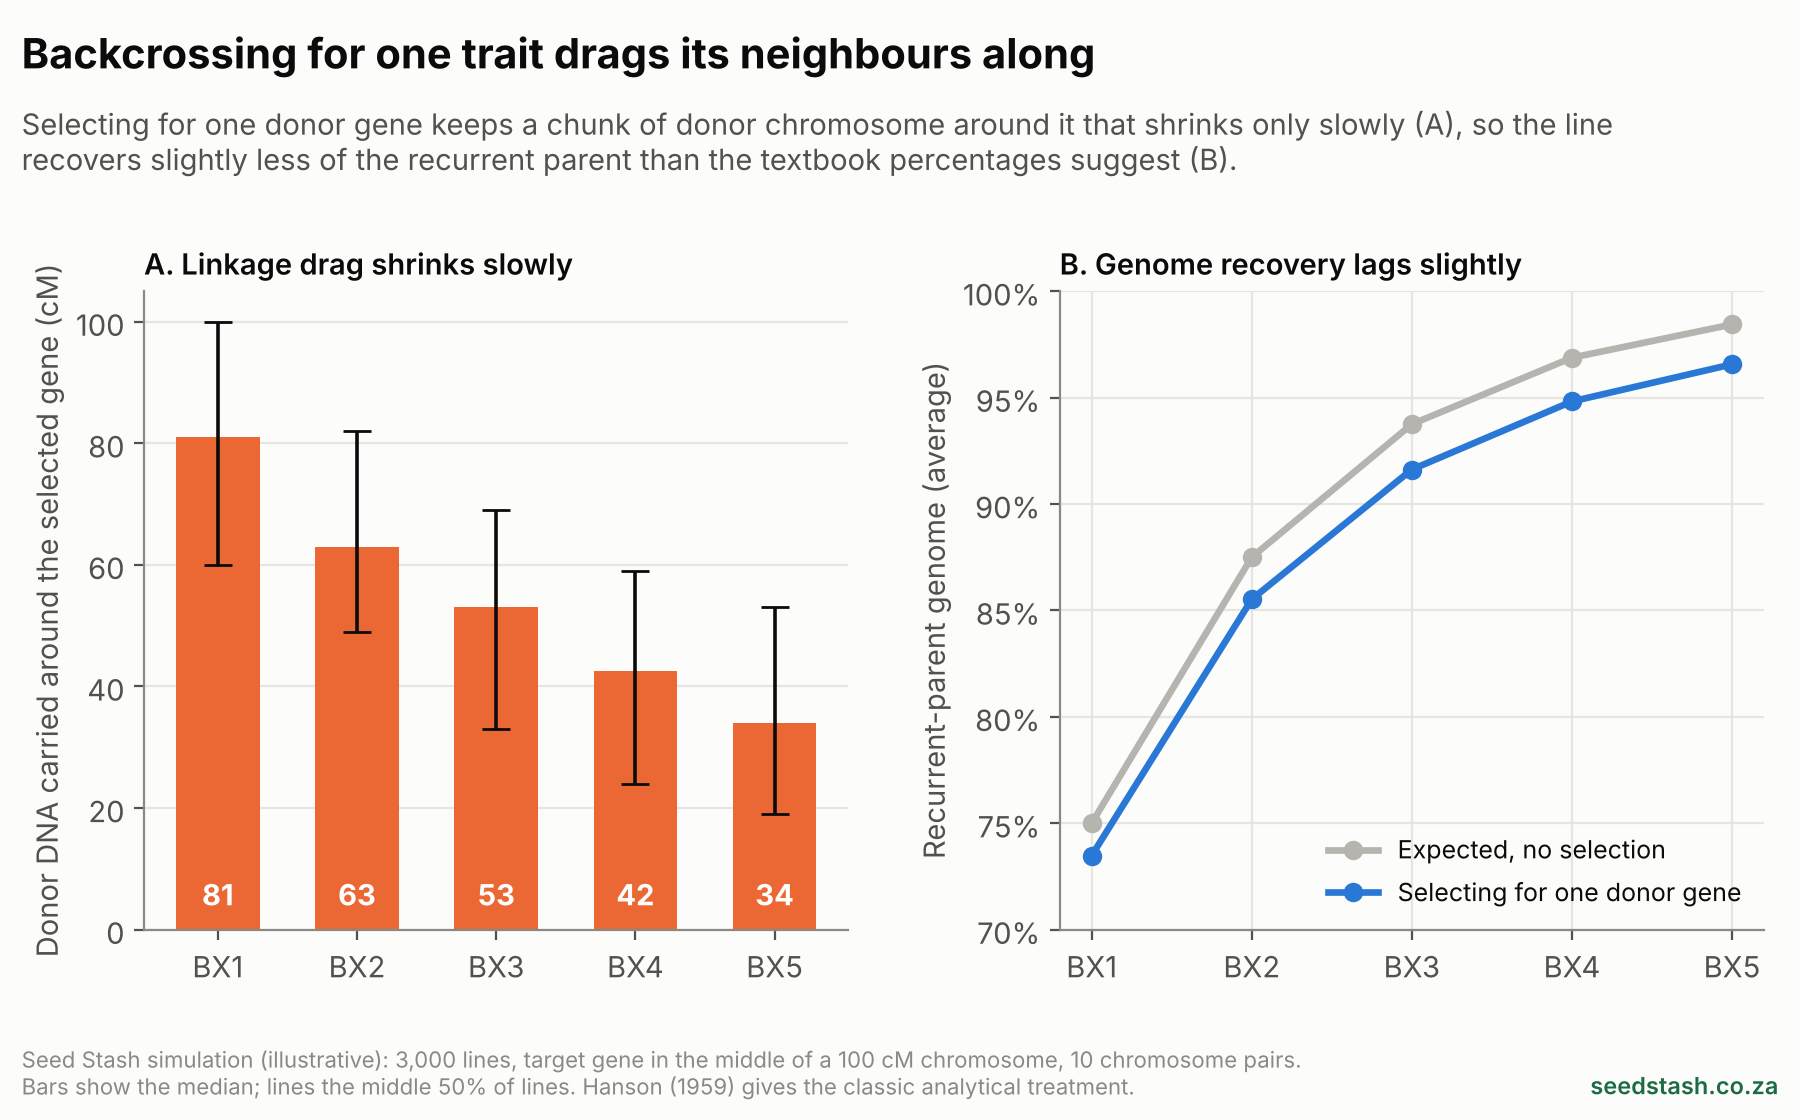
A typical backcross programme crosses a donor with a valuable mother, then crosses offspring carrying the wanted donor trait back to the mother repeatedly. Two things complicate the textbook percentages. First, genes are carried on chromosomes in long stretches, so individual offspring inherit lumpy, uneven shares rather than exactly half of each parent; Figure 3 shows the resulting spread.
Second, selecting for the donor trait keeps the stretch of donor chromosome around it. Our simulation placed the target gene in the middle of one chromosome. After five backcrosses the donor stretch around it still spanned a median of 34 cM, about a third of that chromosome (Figure 7A). Genome-wide recovery lagged the textbook figures a little as a result: 96.6% instead of 98.4% at BX5 (Figure 7B). Hanson worked out this slow erosion analytically in 1959.7 In practice, an unwanted trait sitting close to the one you are selecting for can ride along for many generations.
9. How confident can we be?
Section summary
- The generation-by-generation maths is textbook genetics and very reliable as an average.
- Evidence on what inbreeding does to cannabis specifically is consistent but comes from few studies and cultivars.
| Claim | Confidence | Why |
|---|---|---|
| Variation left by generation (selfing, sib, backcross) | Higher | Standard population genetics; confirmed by our simulations |
| Seeds-to-pop numbers | Higher for the maths | Exact for single-gene, unlinked traits; real traits often need more |
| Inbreeding reduces cannabis vigour and yield | Moderate | Three controlled studies agree; few cultivars, mostly hemp |
| F1 hybrids from inbred lines are more uniform and vigorous | Moderate | Two small studies; depends on the parent pairing |
| Commercial seed lots often vary widely | Moderate | One large genetic survey of 22 US hemp varieties |
| Feminised sister lines inbreed at the same rate as brother × sister lines | Higher | Same relationship, same formula |
| Feminised lines fix selected flower traits faster | Limited | Follows from selection theory; no cannabis comparison found |
| S1s throw more hermaphrodites | Unresolved | No controlled study found |
| Simulated line divergence and linkage drag | Illustrative | Direction is well established; exact sizes depend on the genetic map and trait |
The study cannabis breeding most needs is a side-by-side trial of drug-type cultivars: S1 to S4 and sibling lines from the same mothers, alongside F1 hybrids between them, measuring yield, chemistry, uniformity and sex stability. Most current evidence comes from hemp, and THC-dominant cultivars could behave differently.
Conclusion
Every seed-pack label is shorthand for a predictable amount of genetic shuffling. Selfing halves the hidden variation each generation; sibling crosses get there slowly, especially with many parents; backcrosses pull a line towards one parent on average while individual plants scatter around it. Those numbers tell you how many seeds to pop and how much to trust a label like “IBL”.
Inbreeding has a cost. In the controlled cannabis studies so far, selfed and inbred lines were smaller, yielded less and grew more abnormal flowers. Its payoff comes when two inbred lines are crossed: the resulting F1 hybrids were more uniform and often more vigorous. Inbreeding is a tool for building better parents, not a goal in itself.
References
- Falconer DS, Mackay TFC (1996). Introduction to Quantitative Genetics, 4th edition. Harlow: Longman. Chapter 5, Inbreeding and relationship.
- Kurtz LE, Mahoney JD, Brand MH, Lubell-Brand JD (2020). Comparing genotypic and phenotypic variation of selfed and outcrossed progeny of hemp. HortScience 55(8):1206–1209. doi.org/10.21273/HORTSCI15061-20
- Garcia-de Heer L, Mieog J, Burn A, Nolan M, Liu L, Manansala-Siazon S, Kretzschmar T (2026). Weeding out variability: a proof-of-concept for producing uniform F1 hybrid Cannabis sativa L. using single-seed descent. Horticulture Research 13: uhag038. doi.org/10.1093/hr/uhag038
- McDonald MM, Lubell-Brand JD (2024). F1 hybrid seed can enhance cannabis crop uniformity and yield. HortScience 59(12):1795–1799. doi.org/10.21273/HORTSCI18197-24
- Johnson MS, Wallace JG (2021). Genomic and chemical diversity of commercially available high-CBD industrial hemp accessions. Frontiers in Genetics 12:682475. doi.org/10.3389/fgene.2021.682475
- Lubell JD, Brand MH (2018). Foliar sprays of silver thiosulfate produce male flowers on female hemp plants. HortTechnology 28(6):743–747. doi.org/10.21273/HORTTECH04188-18
- Hanson WD (1959). Early generation analysis of lengths of heterozygous chromosome segments around a locus held heterozygous with backcrossing or selfing. Genetics 44(5):833–837.
Methods and editorial notes
How this review was done. This is a targeted editorial review, not a systematic review. We searched scholarly and publisher sources in October 2026 for controlled studies of selfing, inbreeding depression and F1 hybrids in cannabis and hemp. We read the full text of references 2, 3 and 5. For reference 4 we had the abstract and summary reporting only, so we cite it for direction of effects, not numbers.
Calculations. Hidden variation left is 1 − F, relative to the starting plant or founders, using the formulas in Falconer and Mackay.1 Selfing and single-pair sibling results were checked against a 200,000-replicate simulation. Seeds-to-pop counts use n = log(1 − confidence) ÷ log(1 − p), with p = (¼)k for F2/S1 and (½)k for BX1. Expected best-of-n values are the expected maximum of n independent normal values.
Simulations. Figures 3, 6 and 7 come from simulations on 10 chromosome pairs (cannabis has 2n = 20), each set at 100 cM with random crossovers. That map length is illustrative, not a measured cannabis map. Figure 6 uses 200 additive genes, heritability 0.6 within the S1 family and 300 plants per family. These figures show patterns, not predictions for a specific cultivar.
Interests. Seed Stash sells cannabis seeds. This article does not recommend any breeder, strain or product.