
How Much Light Is Too Much? What Controlled Studies Reveal About Light Intensity, Yield and Potency

Ask ten growers how much light cannabis needs and you will hear ten numbers. Most of those cannabis light intensity targets come from single-leaf photosynthesis readings or lighting marketing, not from harvested flower. Since 2021, a small set of controlled indoor studies has measured what growers actually care about: dry flower yield and its chemistry across a range of light intensities.
The answer is clearer than the folklore. In every study that measured yield across light levels, more light during flowering produced more flower, and none found a plateau up to 1,800 µmol·m⁻²·s⁻¹. What extra light did not reliably do was make flower stronger. Most studies found cannabinoid concentration unchanged; one found it rose. This article shows the data, explains why the studies differ, and sets out what is still unknown.
Table of Contents
The evidence at a glance
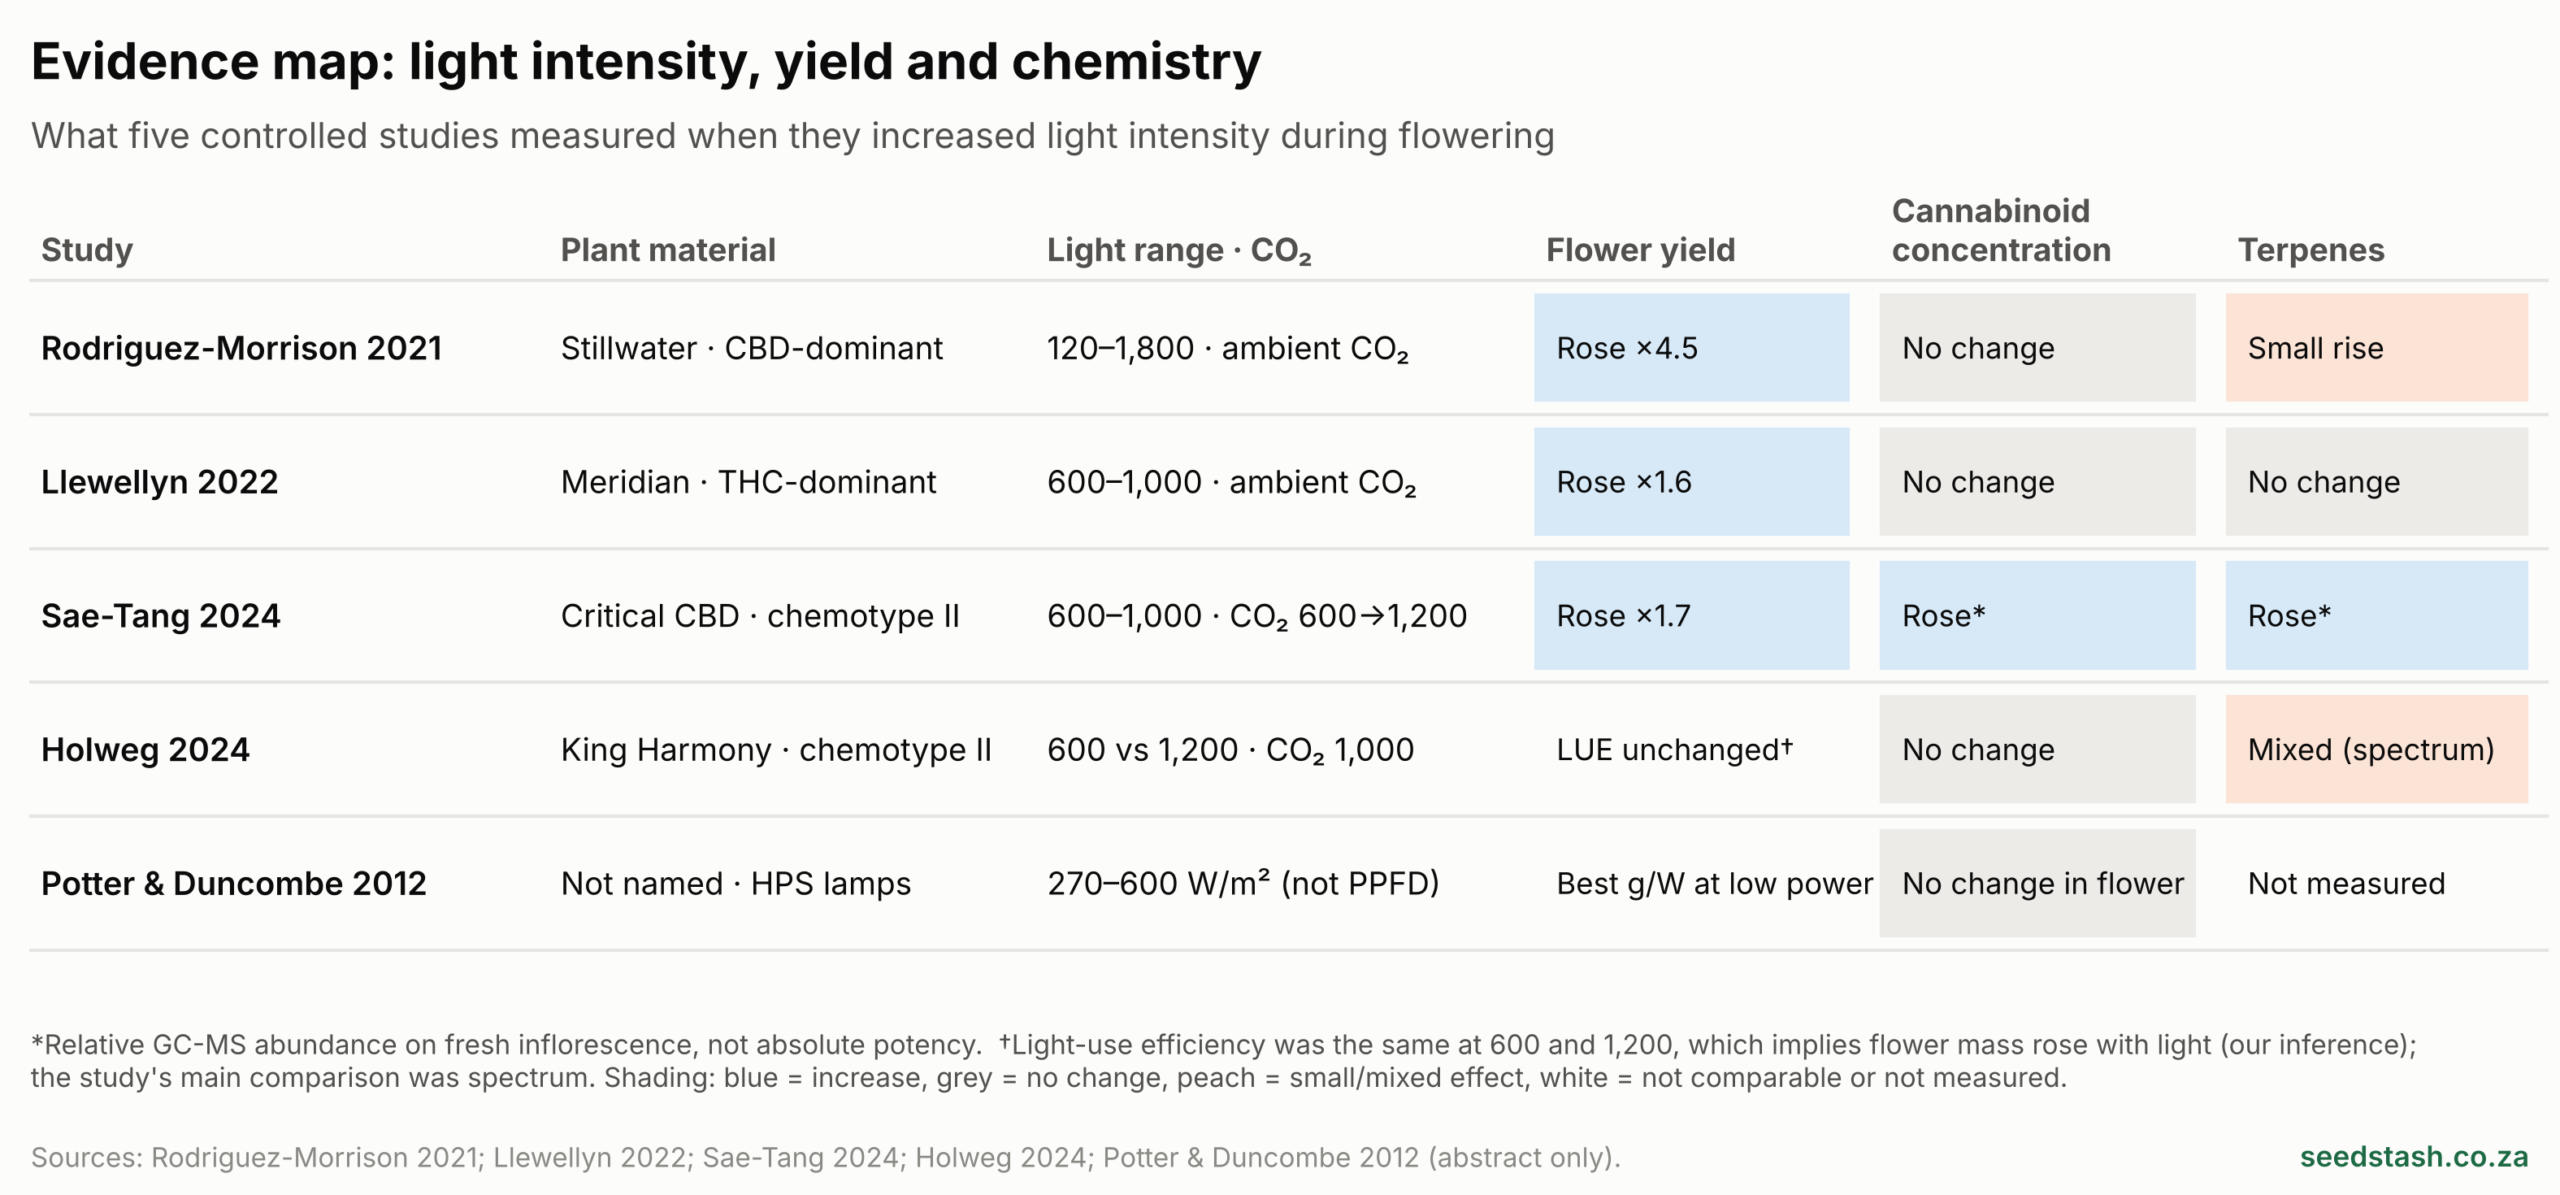
Five controlled studies, four LED-lit and one under high-pressure sodium lamps. All evidence below is from plant experiments, not human studies, and each LED study tested a single cultivar.
×4.5
dry flower yield from 120 to 1,800 PPFD in one cultivar (116 → 519 g/m²)1
4 of 5
studies that measured it found no significant change in flower cannabinoid concentration1,2,4,5
−15%
grams of flower per kWh when light was doubled from 900 to 1,800 (yield +70%)1
1 · More light, more flowerYield rose with light in every study that reported it across PPFD levels, roughly in step with light between 600 and 1,000, and still rising at 1,800 in the one study that went that high.
Higher confidence to ~1,000 · Moderate to 1,800Main limitation: one cultivar per study and few independent replicates.
Higher confidence to ~1,000 · Moderate to 1,800Main limitation: one cultivar per study and few independent replicates.
2 · Brighter isn’t strongerFour of five studies found flower cannabinoid concentration did not change with light intensity. One CO₂-enriched study found higher relative levels. Cannabinoids per square metre rose everywhere, because there was more flower.
Moderate confidenceMain limitation: the contradictory study used a different measurement method and CO₂ regime.
Moderate confidenceMain limitation: the contradictory study used a different measurement method and CO₂ regime.
3 · Yield has a priceDoubling light raised yield per square metre but lowered flower per kilowatt-hour. Whether high light pays depends on fixtures, tariffs, cooling and CO₂, not on the plant alone.
Limited confidence (derived estimate)Main limitation: based on one study’s yield model and an assumed fixture efficiency.
Limited confidence (derived estimate)Main limitation: based on one study’s yield model and an assumed fixture efficiency.
1. Measuring cannabis light intensity: PPFD, DLI and why watts mislead
Section summary
- PPFD counts the photosynthetically useful photons landing on a square metre each second. It is the canopy-level number every study here used.
- DLI (daily light integral) is PPFD accumulated over the day. At a 12-hour flowering photoperiod, 1,000 PPFD ≈ 43 mol/m²/day.
- Watts describe what a lamp consumes, not what reaches your plants, so they are a poor proxy for light intensity.
Plants use light between roughly 400 and 700 nanometres for photosynthesis. Researchers call this band photosynthetically active radiation and measure its intensity as the photosynthetic photon flux density (PPFD): the number of photons in that band striking one square metre each second, in micromoles (µmol·m⁻²·s⁻¹). Because PPFD is an instantaneous reading, it is often converted to a daily light integral (DLI), the total photons delivered across the day. The conversion is simple: DLI = PPFD × hours of light × 0.0036.
| PPFD at canopy (µmol·m⁻²·s⁻¹) | 400 | 600 | 800 | 1,000 | 1,200 | 1,500 | 1,800 |
|---|---|---|---|---|---|---|---|
| DLI at 12 h/day (mol·m⁻²·d⁻¹) | 17.3 | 25.9 | 34.6 | 43.2 | 51.8 | 64.8 | 77.8 |
Older yield models, many of them from forensic research into illicit grows, used installed lamp power (watts per square metre) as a stand-in for light. The Guelph team behind the most detailed recent study points out why that is unreliable: hang height, how evenly the fixture spreads its light, and how efficiently it turns electricity into photons all change what the canopy actually receives.1 Small changes in distance from the lamp can also create large differences in the light a given leaf receives. A reading taken at canopy height is therefore the only number that is comparable between grows.
2. What researchers actually tested
Section summary
- Four LED studies (2021–2024) and one older HPS study varied light intensity during flowering and harvested the flower.
- Each LED study tested a single cultivar: one CBD-dominant, one THC-dominant and two with balanced (chemotype II) profiles.
- Designs, CO₂ levels, crop durations and reporting units differ, which limits direct comparison.
| Study | Cultivar (chemotype) | Light levels during flowering | Flowering | CO₂ | Replication | Funding / support |
|---|---|---|---|---|---|---|
| Rodriguez-Morrison 20211 | ‘Stillwater’ (CBD-dominant) | Gradient 120–1,800 PPFD, LED | 81 days | Ambient (~437 ppm by day) | 8 light levels × 6 blocks; 96 plants analysed by regression | Public research grant; a cannabis company provided facility and plants |
| Llewellyn 20222 | ‘Meridian’ (THC-dominant, >20% THC) | 600, 800, 1,000 PPFD, LED (plus UV treatments) | 45 days | Not supplemented | 3 blocks; 6 plants per plot | A cannabis producer funded the study; three co-authors were its employees |
| Sae-Tang 20243 | ‘Critical CBD’ (chemotype II, THC:CBD ≈ 0.5) | 600, 800, 1,000 PPFD, broad-band white LED | 8 weeks | Raised from 600 to 1,200 ppm | 2 repeated experiments; 30 and 18 plants per treatment | Medicinal cannabis company; lighting manufacturer supplied fixtures |
| Holweg 20244 | ‘King Harmony’ (chemotype II) | 600 vs 1,200 PPFD, four LED spectra | 56 days | 1,000 ppm by day | 2 blocks; tested at P = 0.10 | LED manufacturer |
| Potter & Duncombe 20125 | Not stated in abstract | HPS at 270, 400, 600 W/m² (PPFD not reported) | 8 weeks | Not stated in abstract | Not assessed (abstract only) | Not assessed |
All five are controlled plant experiments, the strongest type of evidence available for a cultivation question like this. None is a large multi-cultivar trial, and none was run in a home-grow tent. When we say “yield” below, we mean the dry weight of harvested flower (inflorescence). Studies report it either per square metre or per plant, and as oven-dry or market-dry weight. We keep each study’s own units rather than converting between them.
3. Yield: what they found
Section summary
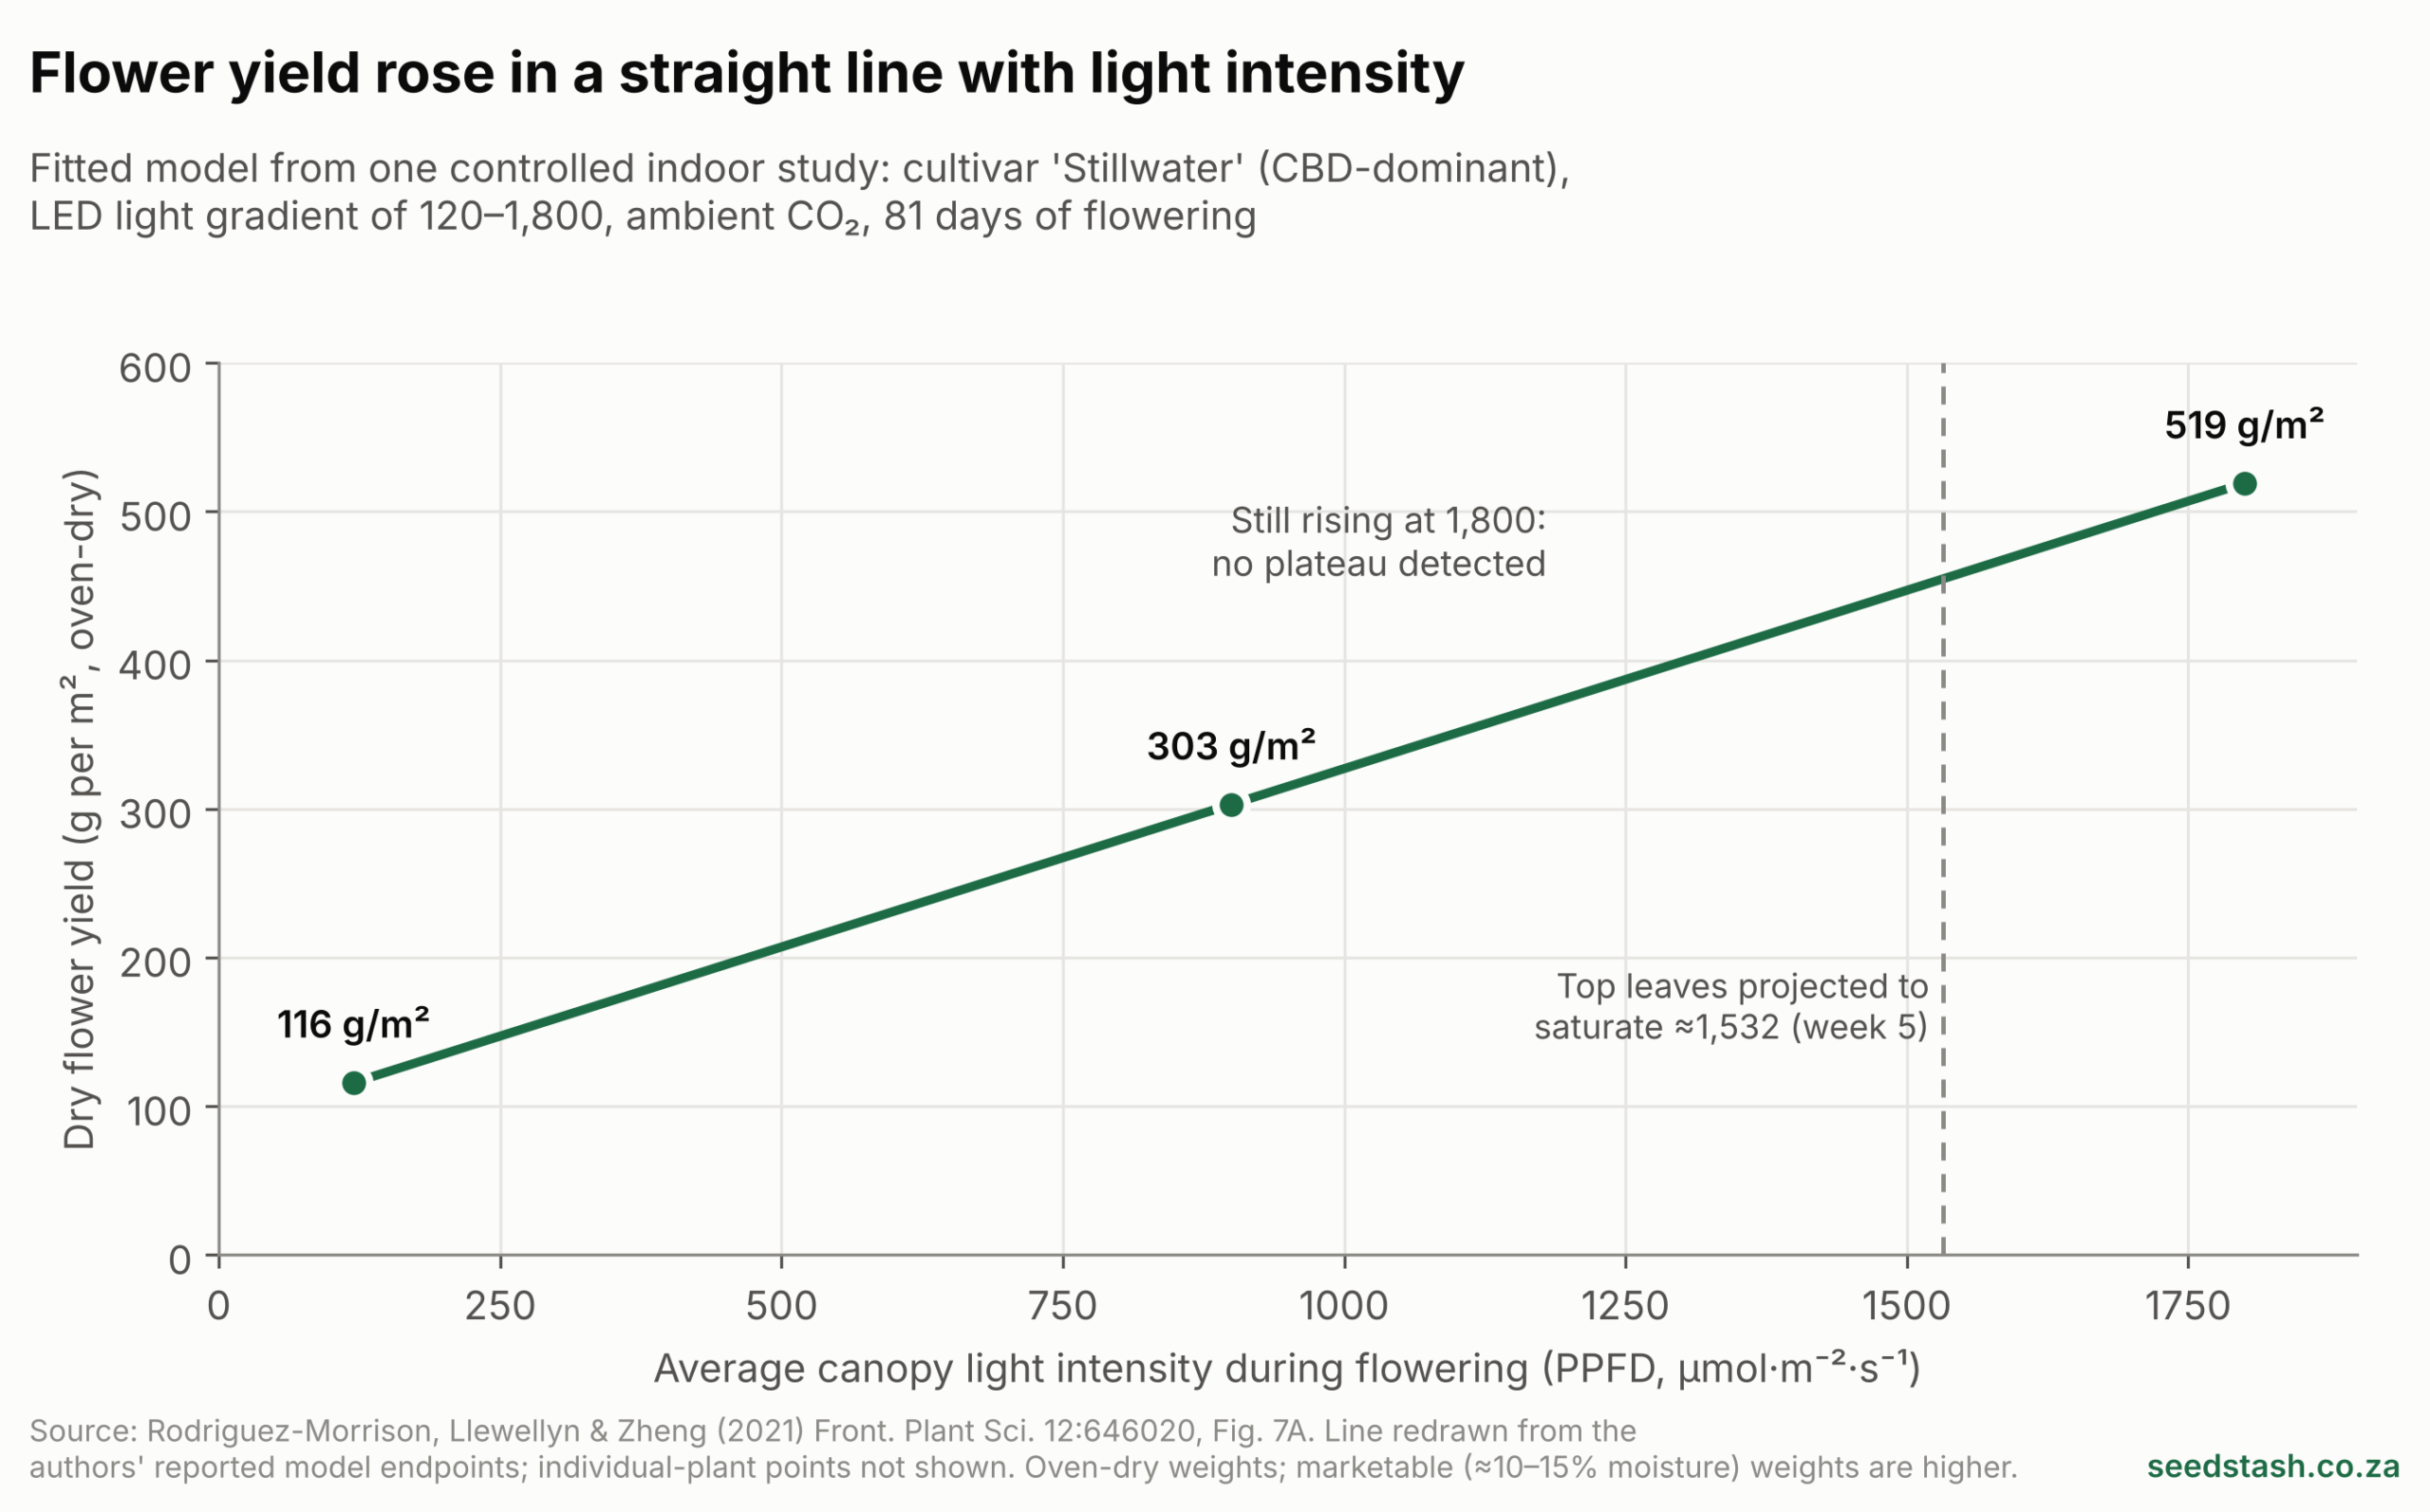
- ‘Stillwater’ yield rose in a straight line from 116 to 519 g/m² of dry flower between 120 and 1,800 PPFD, with no plateau.1
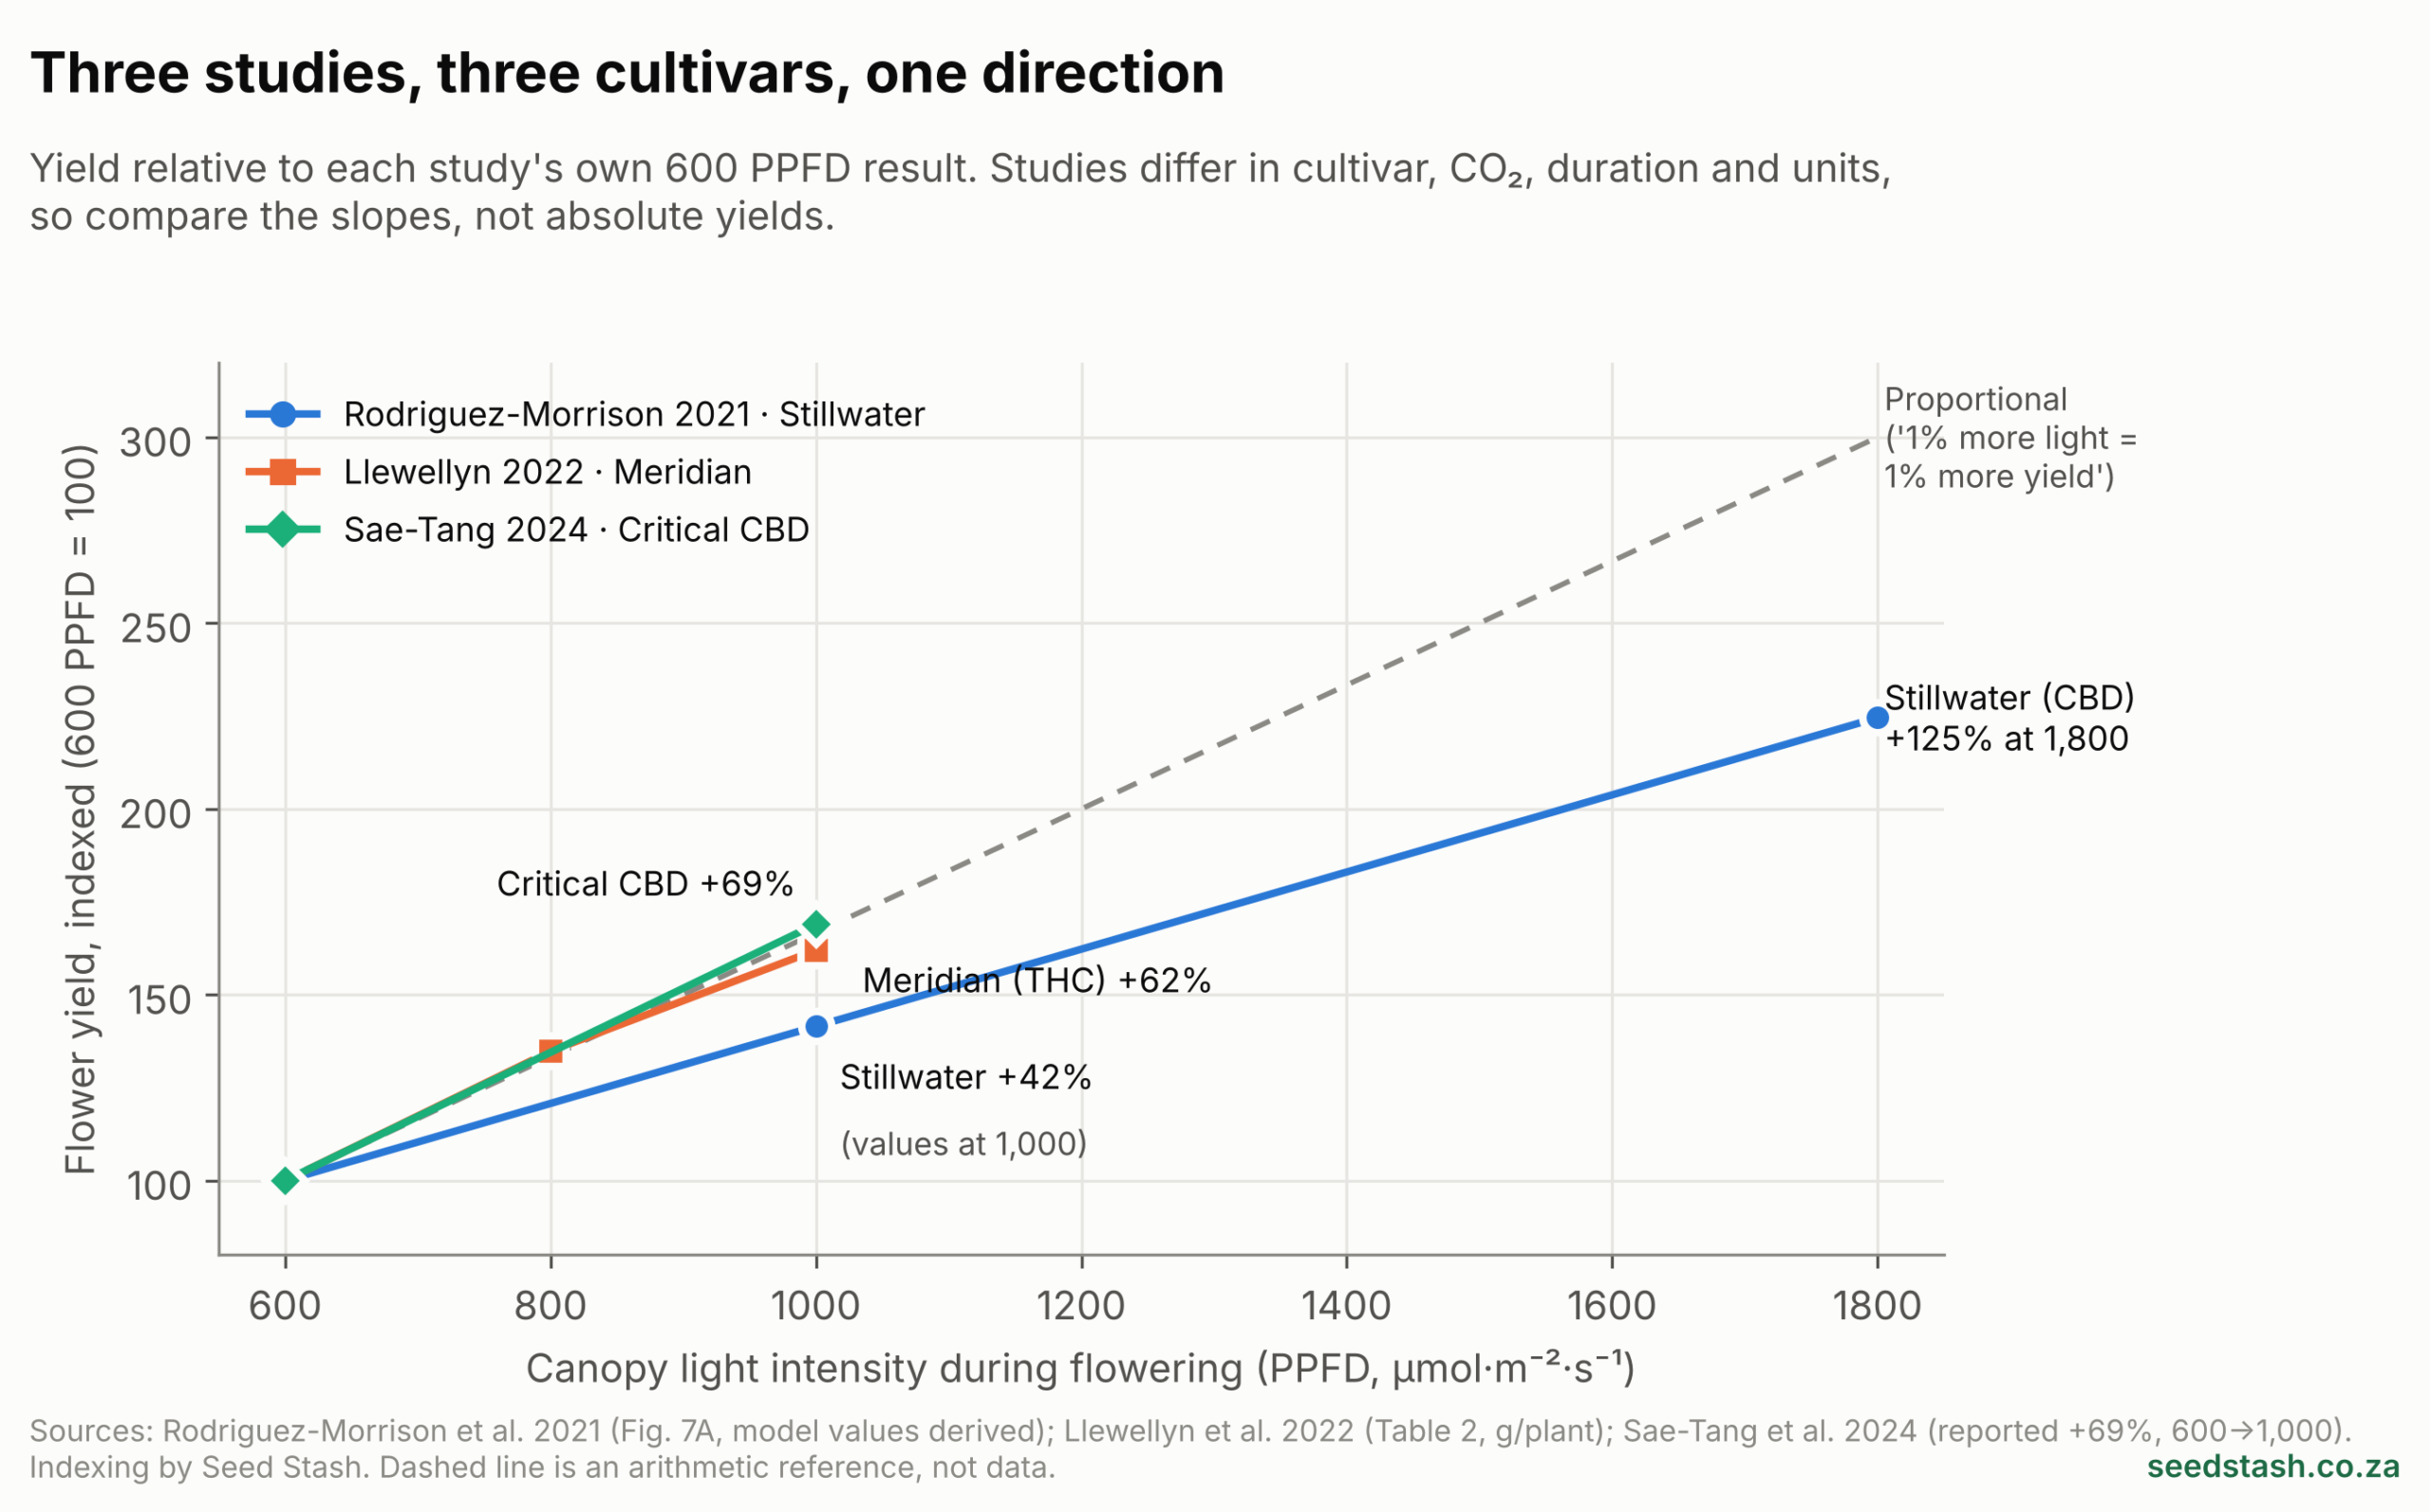
- Between 600 and 1,000 PPFD, ‘Meridian’ yield rose 1.6-fold (27.6 → 44.7 g/plant) and ‘Critical CBD’ rose 69%.2,3
- Single-leaf photosynthesis is a poor guide to crop yield: leaves approached saturation well below the light levels at which yield was still rising.1
- Brighter-grown plants put a larger share of their mass into flower and produced denser top colas.1
The University of Guelph’s 2021 study is the anchor for this topic because of its range. The researchers spread 96 plants across a deliberately uneven LED canopy, tracked the light each plant received through flowering, and modelled yield against each plant’s average light level. Dry flower yield rose linearly from 116 to 519 g/m², a 4.5-fold increase, as average canopy PPFD rose from 120 to 1,800.1 That happened under ordinary room CO₂, which the authors interpret as light still limiting whole-canopy photosynthesis even at the top of their range.
The magnitude matters as much as the direction. In the same model, doubling light from 900 to 1,800 PPFD raised predicted yield by about 70%, not 100%.1 Light helped a great deal, but in this cultivar yield did not scale one-for-one with light.
The two shorter studies tell a slightly more generous story over a narrower range. For the THC-dominant ‘Meridian’, a 1.67-fold increase in light (600 → 1,000) produced a 1.6-fold increase in dry flower per plant. The authors estimate that every extra 100 PPFD added about 4.6 g per plant, or 51 g/m² at their planting density.2 In ‘Critical CBD’, a 67% increase in light produced a 69% increase in flower dry mass, so light-use efficiency stayed constant at about 0.25 g of flower per mole of light.3
Why leaf readings mislead
Many lighting recommendations are built on how fast a single leaf photosynthesises at different light levels. The Guelph study measured this directly and found it varied with the leaf’s own light history and with crop age. Leaves grown in bright spots could use more light than those grown in shade, and older leaves late in flowering photosynthesised less.1
Leaf photosynthesis approached saturation well below 1,800 PPFD while yield kept rising. The authors concluded that a leaf’s light response is not a reliable predictor of what the whole plant will yield.1 One likely reason is that a canopy is layered: when the top is bright, more light filters through to lower leaves that are far from saturation. In the Wageningen study, which measured leaves at 800 ppm CO₂, leaf photosynthesis had still not saturated at 3,000 PPFD.3 That contrast is itself a clue that CO₂ sets part of the ceiling.
Where the extra mass goes
Light did not simply make plants bigger. In ‘Stillwater’, the share of above-ground dry mass that was flower (the harvest index) rose from 0.56 to 0.73, and the density of the top cola rose about 1.3-fold.1 In ‘Meridian’ the harvest index also trended upwards, though not significantly.2 In ‘Critical CBD’, most of the gain came from more total plant growth, with only a small (3.4%) shift towards flower.3
A 2020 study run with a commercial grower also reported a linear yield response up to about 1,500 PPFD, though it had only one treatment above 1,000 (as described by the Guelph authors).7
Higher confidence: flower yield increases with light intensity between roughly 600 and 1,000 PPFD across the cultivars tested. Moderate confidence: it keeps increasing up to 1,800 PPFD, since that comes from one cultivar at ambient CO₂. No peer-reviewed study we found has tested where the response finally levels off.
4. Potency: does brighter mean stronger?
Section summary
- ‘Stillwater’: no effect of light on any measured cannabinoid across 120–1,800 PPFD.1
- ‘Meridian’: total THC of 205, 205 and 225 mg/g at 600, 800 and 1,000 PPFD, which was not a statistically significant difference.2
- ‘King Harmony’ and an older HPS study also found no change in flower cannabinoid concentration.4,5
- ‘Critical CBD’ is the exception: relative cannabinoid and terpenoid levels rose with light.3
- Cannabinoids per plant or per square metre rose in every study, because there was more flower.
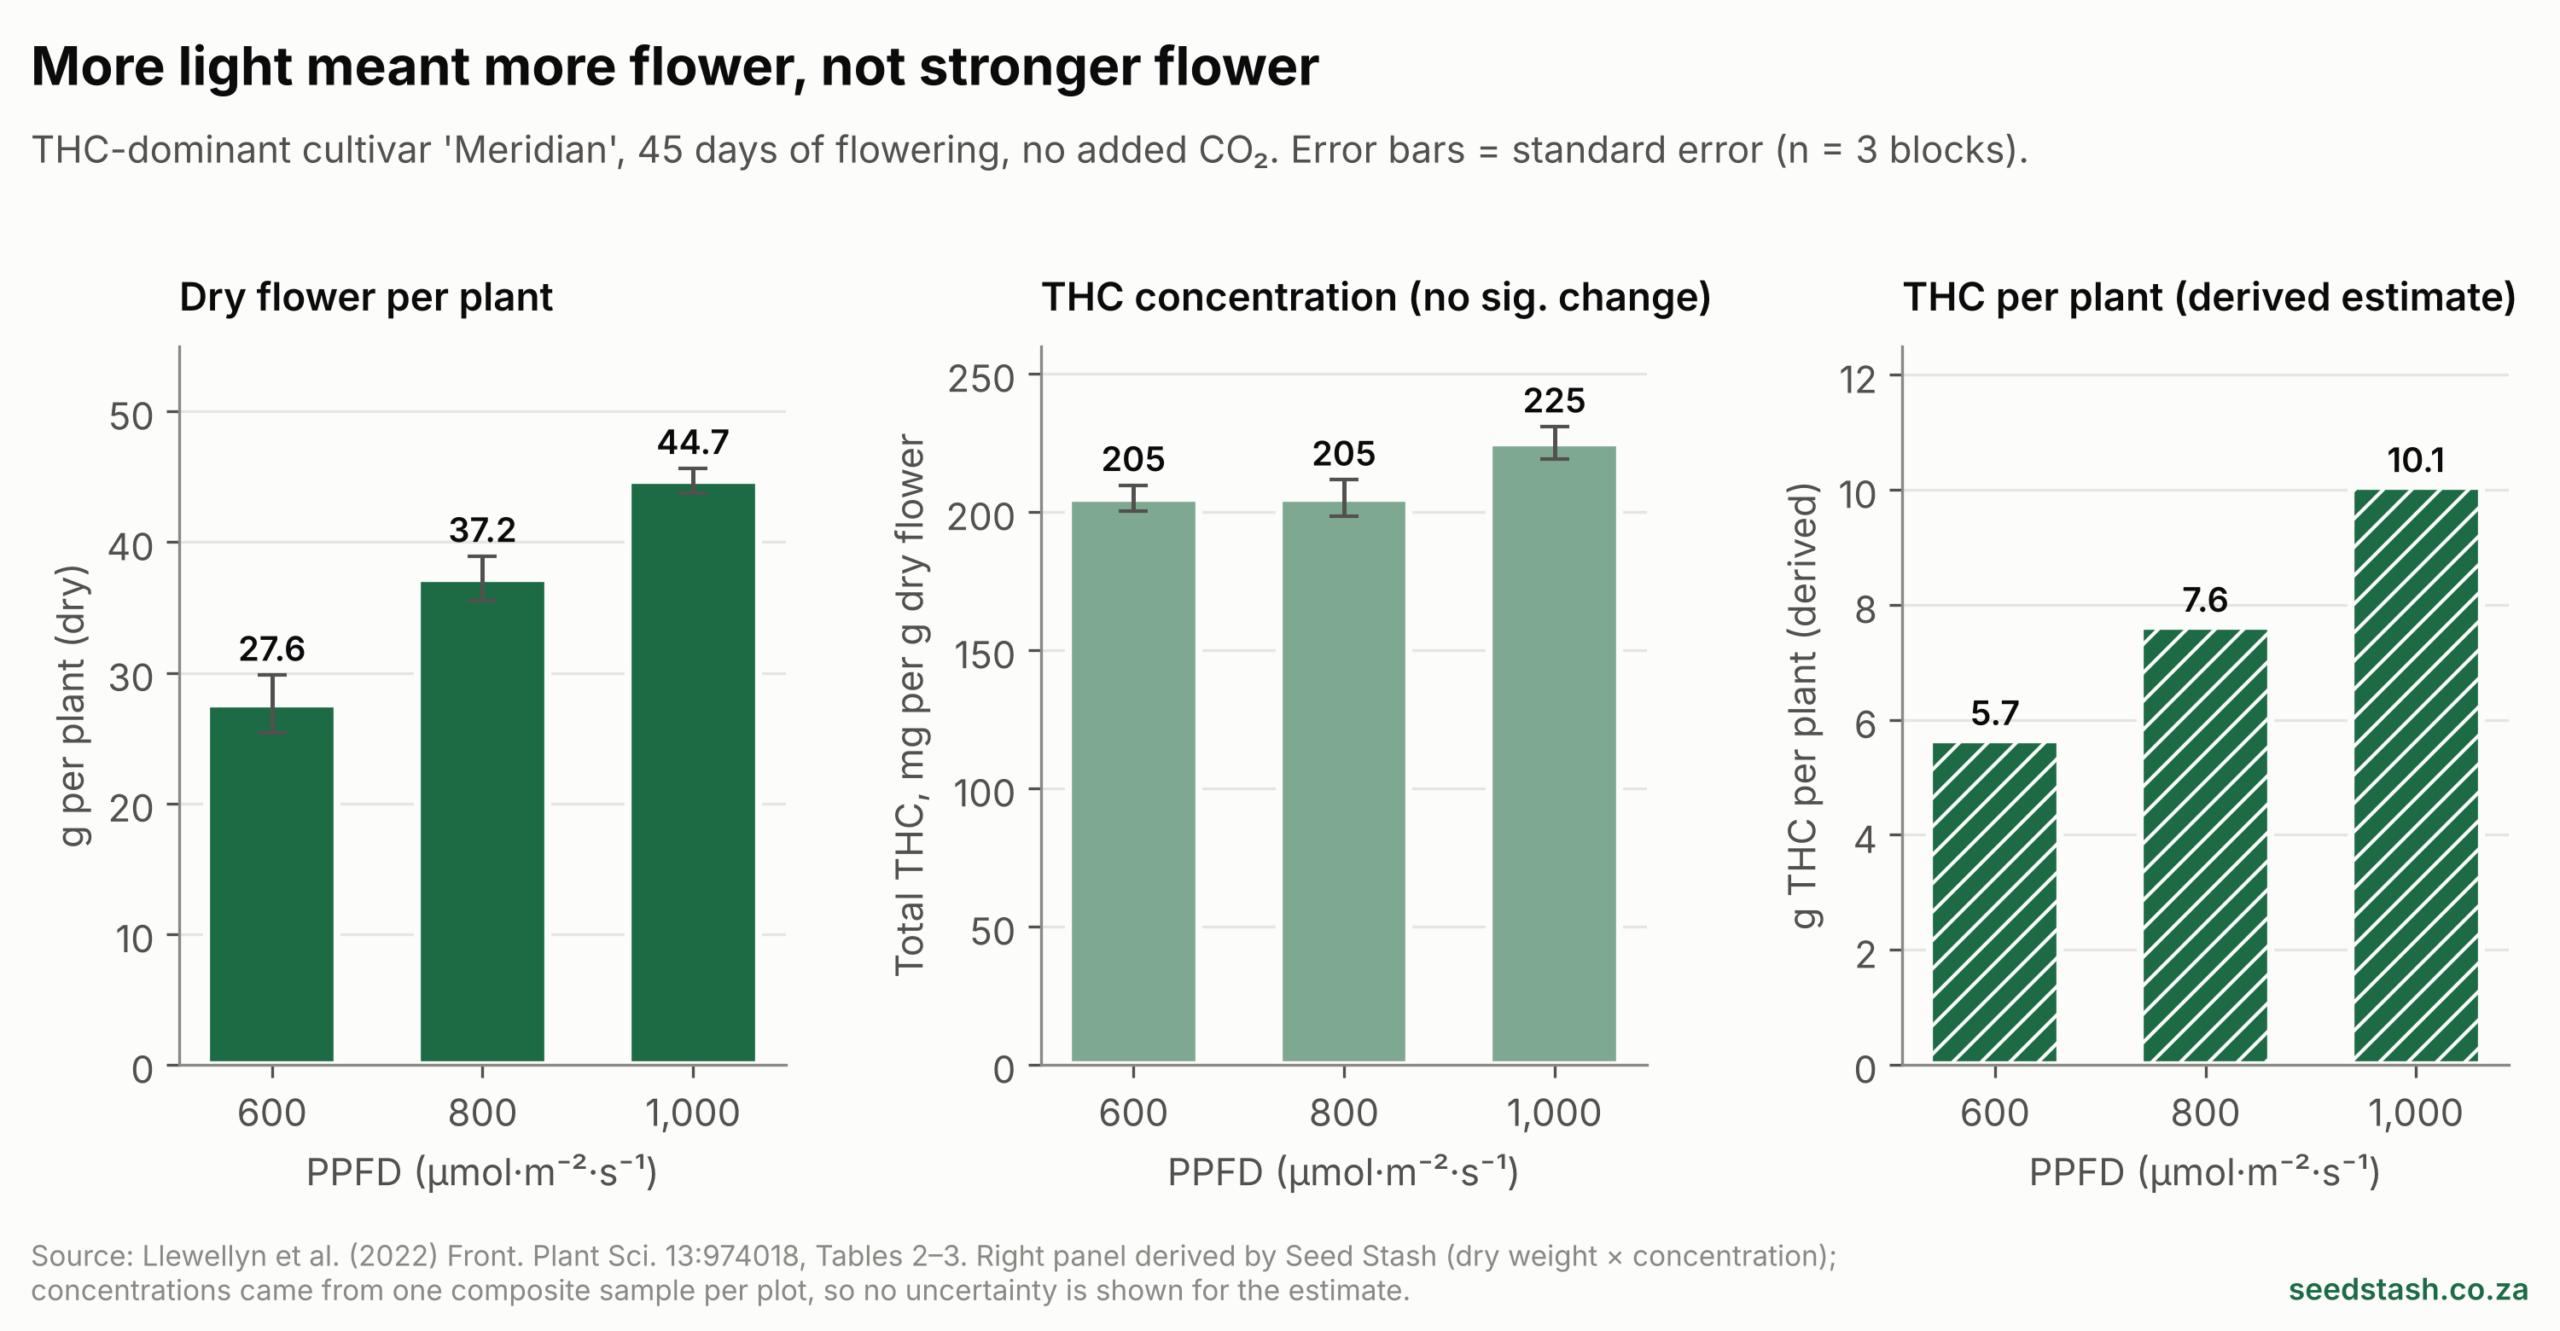
The popular belief is that intense light “pushes” a plant into making more cannabinoids. Most of the controlled data do not support that. The Guelph study analysed dried top colas from 22 plants across its full light range and found no effect of light on any cannabinoid. The flower was dominated by CBDA (214 mg/g).1 In the THC-dominant ‘Meridian’, total THC sat at 205, 205 and 225 mg/g across the three light levels, and the differences were not statistically significant.2
The Wageningen spectrum study found no effect of 600 versus 1,200 PPFD on total or individual cannabinoids.4 The older HPS study reported that leaf and flower potency did not change as lamp power rose. Whole-plant potency increased only because brighter plants carried a larger share of flower.5
The clear exception is the 2024 ‘Critical CBD’ study. There, total cannabinoid and terpenoid levels rose linearly with light. Combined with more flower, that meant cannabinoid yield per plant rose by 140% and terpenoid yield by 214% between 600 and 1,000 PPFD.3 This is a real and well-designed result, and it should not be dismissed. It differs from the others in several ways that could explain the gap:
- Method: compounds were measured by GC-MS as abundance relative to an internal standard, in fresh-frozen samples from the top 5 cm of flowers. The Guelph and ‘Meridian’ studies reported absolute concentrations in dried, homogenised flower tested by commercial laboratories.1–3
- CO₂: it was raised to 1,200 ppm during flowering. The two THC/CBD-dominant studies ran at ambient or unsupplemented CO₂.1–3
- Drying: its authors suggest that monoterpene losses during drying may have masked light effects in studies that tested dried flower.3
- Genetics: discussing UV light, the ‘Meridian’ authors suggest a cultivar already producing THC near its genetic capacity may have little room to respond to environmental stress.2 The same logic may apply to light intensity, though that is our inference.
Terpenes
The terpene picture is mixed. In ‘Stillwater’, total terpenes rose from 8.85 to 12.7 mg/g across the light range, driven by myrcene (2.51 → 4.90 mg/g) and limonene (1.05 → 1.60 mg/g); other terpenes were unaffected.1 ‘Meridian’ showed no change in total or individual terpenes.2 ‘Critical CBD’ showed a 76% rise in total terpenoids with a 67% increase in light.3 In ‘King Harmony’, terpene levels at high light differed by spectrum: one of the four LED spectra raised them. That same spectrum produced bleached flower tips at 1,200 PPFD.4
Moderate confidence: raising light intensity does not substantially raise cannabinoid concentration in the cultivars tested at ambient CO₂. Unresolved: whether modest increases occur in some cultivars, especially under CO₂ enrichment. Limited confidence: any consistent effect on terpenes.
5. Why findings differ, and what the studies can’t tell us
Section summary
- Each LED study used one cultivar, so results may not transfer to others.
- Many plants per treatment is not the same as many independent tests: most designs had only two or three replicate blocks.
- CO₂, crop length, measurement method and reporting units all differ between studies.
- Industry partners funded or supported most of this research, and independent replication is still thin.
In plant experiments, the number that sets statistical strength is the number of independent treatment units, not the number of plants. Plants that share a light zone, a chamber or a run share everything else too. ‘Meridian’ had three replicate blocks.2 ‘Critical CBD’ had two repeated runs.3 ‘King Harmony’ had two blocks and was tested at a looser significance threshold (P = 0.10). One of its runs was also hit by hop latent viroid and harvested early.4
The Guelph gradient design spread plants across six blocks and modelled a continuous response. That suits a dose-response question, but it is still one cultivar in one facility.1
There is also an upper-range gap. We found no peer-reviewed study testing flowering cannabis well above 1,800 PPFD. A 2024 Utah State University master’s thesis explored light levels above summer sunlight. Its abstract reports that flower yield and cannabinoid content per area rose with light, while CBD concentration fell in one of its cultivars. That work is not peer-reviewed, and we have assessed only the abstract.6 High light also brings problems the yield models don’t capture: more heat, and the bleached flower tips seen in the Wageningen spectrum study.4
Finally, funding. A public research grant supported the Guelph study, with a cannabis company supplying the facility and plants.1 A cannabis producer funded the ‘Meridian’ study and employed three of its authors.2 A medicinal cannabis company funded the ‘Critical CBD’ study, and an LED maker funded the spectrum study.3,4 Funding does not invalidate the results, which are published with their methods. It is one more reason to want independent replication across more cultivars.
6. The cost side: grams per kilowatt-hour
Section summary
- In the Guelph model, doubling light from 900 to 1,800 PPFD raised yield about 70% but cut lighting efficiency by about 15% (0.54 → 0.46 g/kWh).1
- Higher light trades electricity for space: more flower per square metre, slightly less per unit of power.
- The ‘Meridian’ authors estimated the extra electricity cost for each extra gram as small relative to its market value under Canadian prices.2 Your own maths depends on your fixtures and tariff.

Because the Guelph yield line does not pass through zero, yield grows more slowly than light in proportional terms: doubling light less than doubles yield. That is why grams per kilowatt-hour fall as intensity rises, even while grams per square metre keep climbing.1 In practice the question is which constraint binds: space or power. Where growing space is fixed and electricity is cheap, more light buys more flower. Where power is expensive or heat is hard to remove, the efficiency loss matters more.
The ‘Meridian’ authors worked through a marginal version of this sum. They assumed modern LEDs at 2.5 µmol/J and electricity at CAD 0.10 per kWh. On that basis, the extra light needed for each extra gram cost roughly CAD 0.04, or about 1% of the wholesale price of dried flower in Canada at the time.2 They stress that this excludes fixtures, cooling and other inputs.2 South African tariffs, fixtures and climates differ, so treat these figures as a method to repeat with your own numbers, not as a result to copy.
7. What this means for growers and connoisseurs
Section summary
- On current evidence, light intensity is a yield lever, not a potency lever.
- How strong the flower is appears to depend mainly on the plant itself (its genetics and maturity), not on how bright the room is.
- Measure light at canopy height with a quantum (PAR) sensor rather than inferring it from lamp wattage.
- High light only pays off if CO₂, temperature, water and nutrition keep pace.
For the connoisseur, the main message is reassuring. Across the cultivars tested, flower grown under more light was largely the same flower, just more of it and denser at the top.1,2 If you are chasing a particular cannabinoid profile, these studies suggest that choosing the plant matters more than turning up the lamp. That interpretation is consistent with the ‘Meridian’ authors’ view that genetics may matter more for THC content than environmental stresses such as UV.2 The CO₂-enriched ‘Critical CBD’ result is a reminder that this is not settled for every cultivar or setup.3
For the grower, two practical points follow directly from the research. First, the light that matters is the light at the canopy, which is why every study here measured PPFD rather than lamp power.1 Second, the studies that pushed light hardest also controlled everything else. The Wageningen authors recommend pairing higher light with enough CO₂.3 The Guelph authors flag the combined effects of light and CO₂ as the next question to test.1
We deliberately do not give a “best” PPFD target. These studies describe how yield responded in specific commercial environments, and none was designed to tell a home grower what to set.
8. What research would settle the open questions
Section summary
- Several cultivars, including THC-dominant types, grown side by side in one design.
- Light × CO₂ factorial trials, extending above 1,800 PPFD.
- Absolute lab quantification of cannabinoids and terpenes, in both fresh and dried flower.
- More independent replicate units, plus quality outcomes that consumers notice, such as aroma.
The most useful next study would grow several cultivars side by side across a wide light range, with and without CO₂ enrichment. It would measure cannabinoids and terpenes in absolute units in both fresh and cured flower, using enough independent rooms or chambers to separate a true light effect from room-to-room noise. That design would show where yield finally saturates and whether potency responses are cultivar-specific. It would also show whether the ‘Critical CBD’ result reflects CO₂, method or genetics.
Conclusion
So how much cannabis light intensity is too much? In controlled indoor research, the honest answer is that nobody has yet found the point where more light stops producing more flower. Yield rose with light intensity in every study that measured it, and in the widest-ranging one it was still rising at 1,800 PPFD. Brighter rooms did not, in most studies, produce stronger flower. They produced more of it, so cannabinoids per square metre rose while concentration largely held steady. Brighter rooms also produced slightly less flower per kilowatt-hour.
The main uncertainty is breadth: each LED study tested a single cultivar, and one CO₂-enriched trial found chemistry did respond. Until multi-cultivar trials close that gap, treat light as a lever for quantity and the plant as the main source of quality.
References
- Rodriguez-Morrison V, Llewellyn D, Zheng Y (2021). Cannabis yield, potency, and leaf photosynthesis respond differently to increasing light levels in an indoor environment. Frontiers in Plant Science 12:646020. doi.org/10.3389/fpls.2021.646020
- Llewellyn D, Golem S, Foley E, Dinka S, Jones AMP, Zheng Y (2022). Indoor grown cannabis yield increased proportionally with light intensity, but ultraviolet radiation did not affect yield or cannabinoid content. Frontiers in Plant Science 13:974018. doi.org/10.3389/fpls.2022.974018
- Sae-Tang W, Heuvelink E, Nicole CCS, Kaiser E, Sneeuw K, Holweg MMSF, Carvalho S, Kappers IF, Marcelis LFM (2024). High light intensity improves yield of specialized metabolites in medicinal cannabis (Cannabis sativa L.), resulting from both higher inflorescence mass and concentrations of metabolites. Journal of Applied Research on Medicinal and Aromatic Plants 43:100583. doi.org/10.1016/j.jarmap.2024.100583
- Holweg MMSF, Kaiser E, Kappers IF, Heuvelink E, Marcelis LFM (2024). The role of red and white light in optimizing growth and accumulation of plant specialized metabolites at two light intensities in medical cannabis (Cannabis sativa L.). Frontiers in Plant Science 15:1393803. doi.org/10.3389/fpls.2024.1393803
- Potter DJ, Duncombe P (2012). The effect of electrical lighting power and irradiance on indoor-grown cannabis potency and yield. Journal of Forensic Sciences 57(3):618–622. doi.org/10.1111/j.1556-4029.2011.02024.x (abstract only)
- Nielson JD (2024). Responses of Medical Cannabis to Daily Light Integrals Higher Than Summer Sunlight: Yield, Morphology, and Quality. MS thesis, Utah State University. digitalcommons.usu.edu/etd2023/379 (abstract only; not peer-reviewed)
- Eaves J, Eaves S, Morphy C, Murray C (2020). The relationship between light intensity, cannabis yields, and profitability. Agronomy Journal 112:1466–1470. doi.org/10.1002/agj2.20008 (as described in reference 1)
Methods and editorial notes
How this review was done. This is a targeted editorial review, not a systematic review. We searched scholarly and publisher sources (October 2026) for controlled studies that varied canopy light intensity during cannabis flowering and measured harvested flower yield and/or chemistry. We then searched for newer and contradictory studies. Full texts of references 1–4 were read and checked against their tables and figures. Claims from references 5 and 6 are limited to their abstracts. Research current to 26 October 2026.
Derived values. Figure 1’s line is redrawn through the reported endpoints of the authors’ linear model (116 g/m² at 120; 519 g/m² at 1,800) and reproduces their stated 303 g/m² at 900. Figure 2’s indices, Figure 4’s THC-per-plant estimate and Figure 5’s g/kWh curve are Seed Stash calculations. In reference 1, the energy conversion is applied as dividing the light integral by about 5.6 mol per kWh, which reproduces the authors’ published 0.54 g/kWh.
Interests. Seed Stash sells cannabis seeds. This article does not recommend any lighting product, and no lighting company was involved in its preparation. Confidence labels are editorial judgements, not formal GRADE ratings. Nothing here describes the legal status of cultivation in any jurisdiction.